January 3rd, 2024 Electricity Seminar
You can view our PowerPoint outlining our electricity solutions in the link attached here

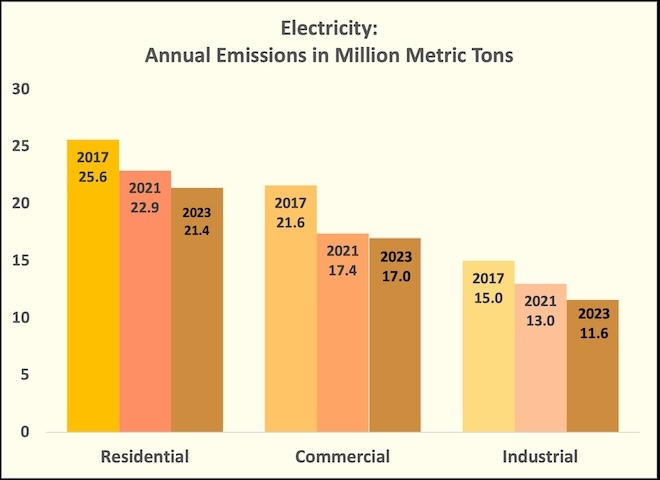
Between 2017 and 2023: GHG emissions from generating and consuming electricity in Georgia have significantly declined
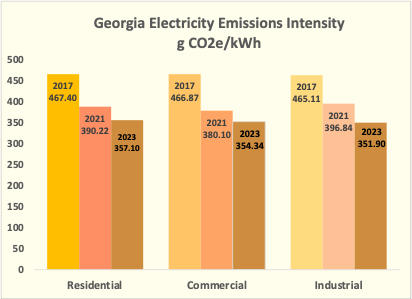
Emissions dropped by nearly 20%, due primarily to the lower carbon intensity of Georgia's electricity generation. This decarbonization has been primarily driven by the retirement of coal plants, increased reliance on natural gas, and the growth of solar power.
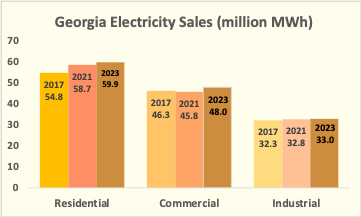
The residential sector consumes the most electricity, followed by commercial buildings and industry. Unlike homes and industry, commercial buildings are powered almost entirely by electricity.

The demand for electricity is growing more rapidly in homes and commercial enterprises, than in industry
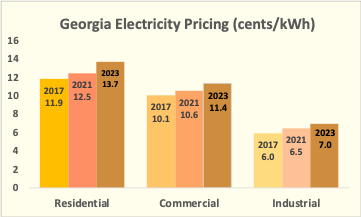
Electricity rates are rising most rapidly in the residential sector


The carbon intensity of electricity is similar across customer classes
Large-Scale Solar

Solar energy only provided 2% of Georgia’s in-state electricity in 2019. Georgia has the 10th highest solar potential in the U.S.
Georgia’s large-scale solar capacity has the potential to more than double to 5.4 GW by 2030
Carbon Drawdown Potential: 1 Megaton of reduction =10 additional 100 MW solar farms and 36 additional 5 MW community solar systems. 9 Megatons of reduction are achievable in Georgia by 2030.
Rooftop Solar

At the end of Quarter 3, 2019, Georgia had 1,202 MW of installed solar on rooftops
Carbon Drawdown Potential:2,580 GWh of zero-carbon electricity generated by 295,000 5-kW solar rooftops, would reduce 1.0 MT of CO2 by 2030.
Cogeneration
 16 additional 25 MW cogen plants using waste heat to generate electricity
In 2017, Georgia had 43 cogeneration facilities totaling 1.4 GW of capacity. Because of Georgia’s amount of heavy industry, there are ample opportunities for cogeneration.
Demand Response

Demand Response can save Georgians approximately $244 million on their electricity cost over the next decade.
Carbon Drawdown Potential: 1 Megaton of reduction =187,000 households participate in a demand-response program, reducing 10% of their peak demand. X Megatons of reduction are achievable in Georgia by 2030.
Landfill Methane

Landfills are a major source of methane emissions. This GHG can be captured and used to generate electricity which can prevent emissions and replace conventional electricity-generating technologies such as coal.
In 2019, Georgia had 92 landfills totaling more than 495Mt of methane-producing waste.
Carbon Drawdown Potential: 4 typical landfill facilities with 5 MW gas-to-energy systems

